general notes
This card provides a short overview on how to use PARD® to:


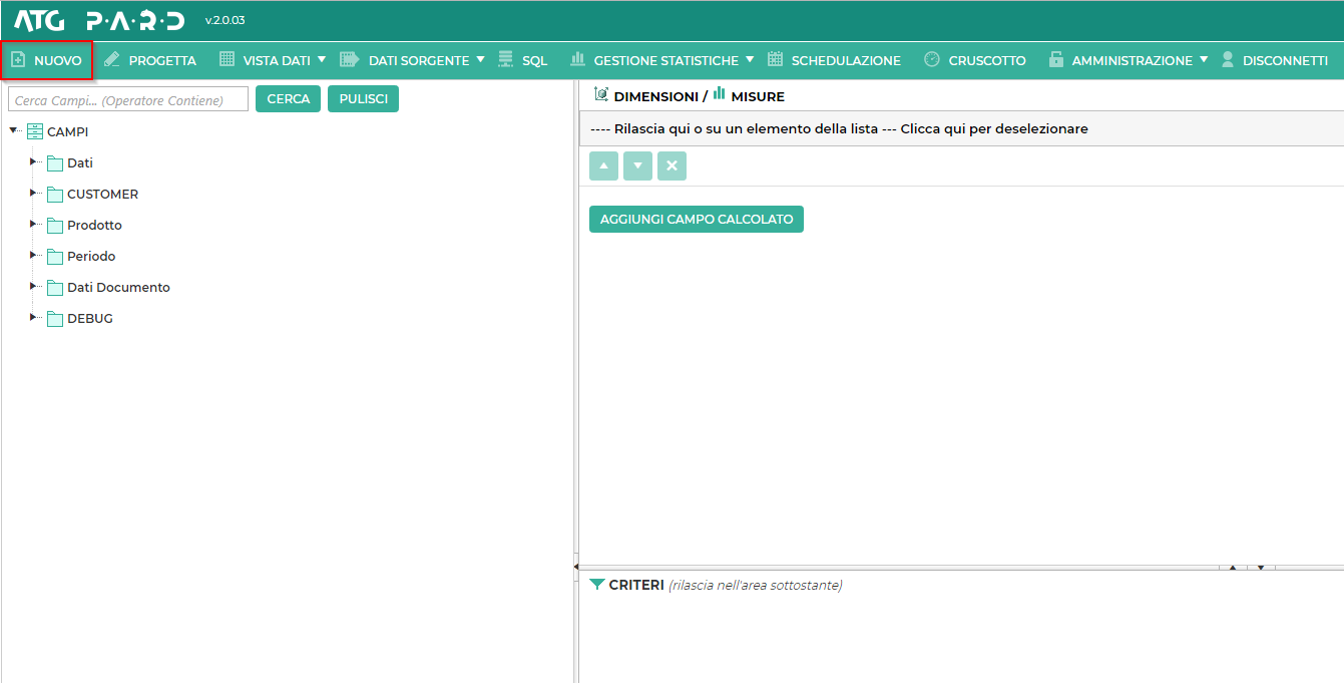
Tool Access
SELECTION OF THE FIELDS TO DISPLAY IN THE REPORT COLUMNS
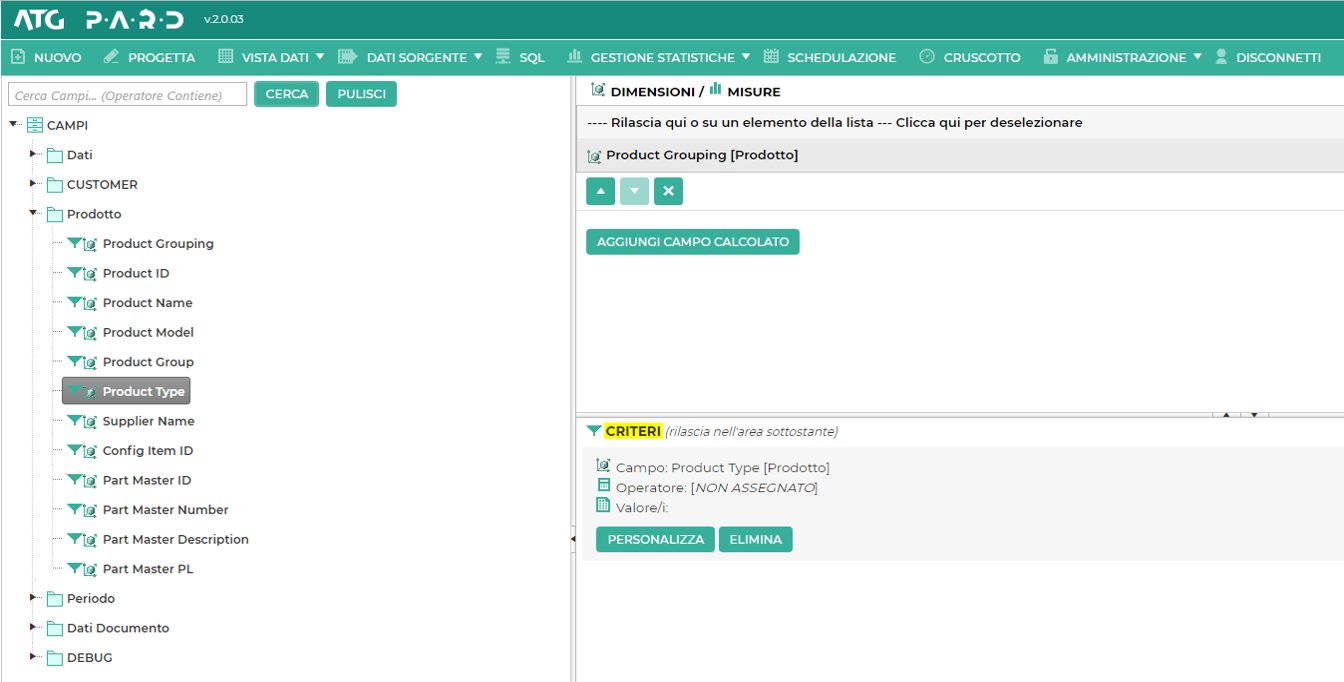
After creating the analysis, the tool allows to drag the desired elements in the FIELD section in the DIMENSION/MEASURES area in order to define which fields to be available in the result
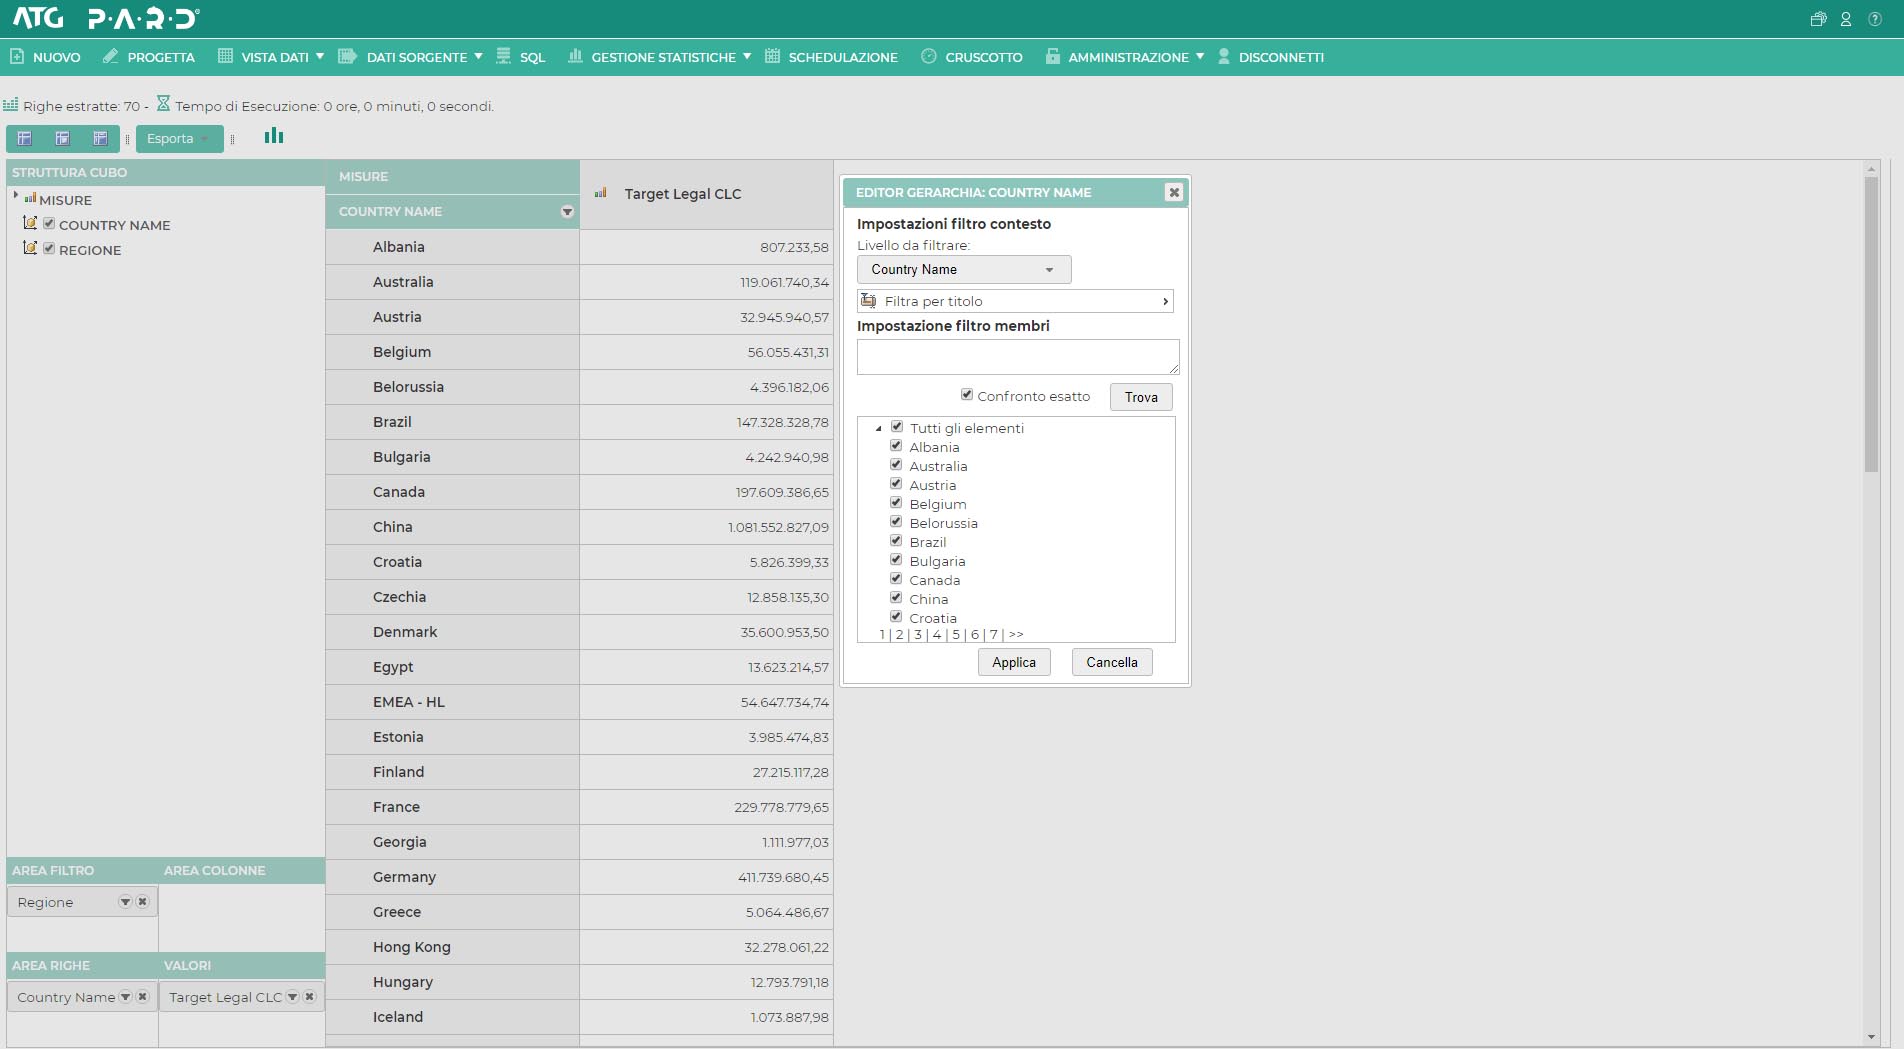
FILTERS SELECTION
USE ADVANCED CRITERIA
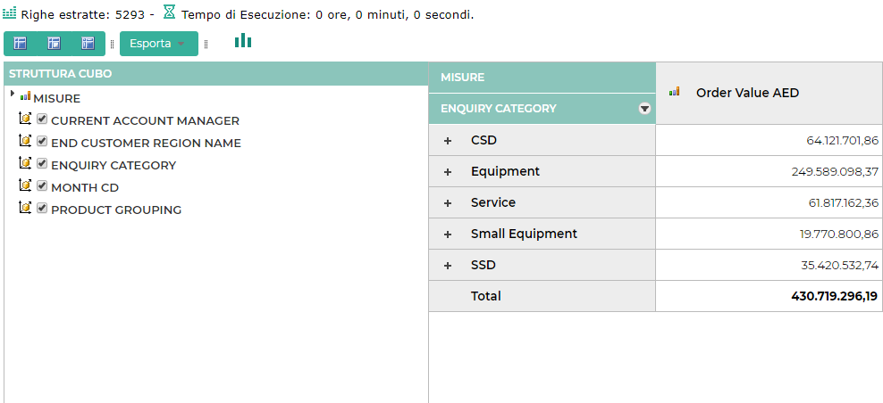
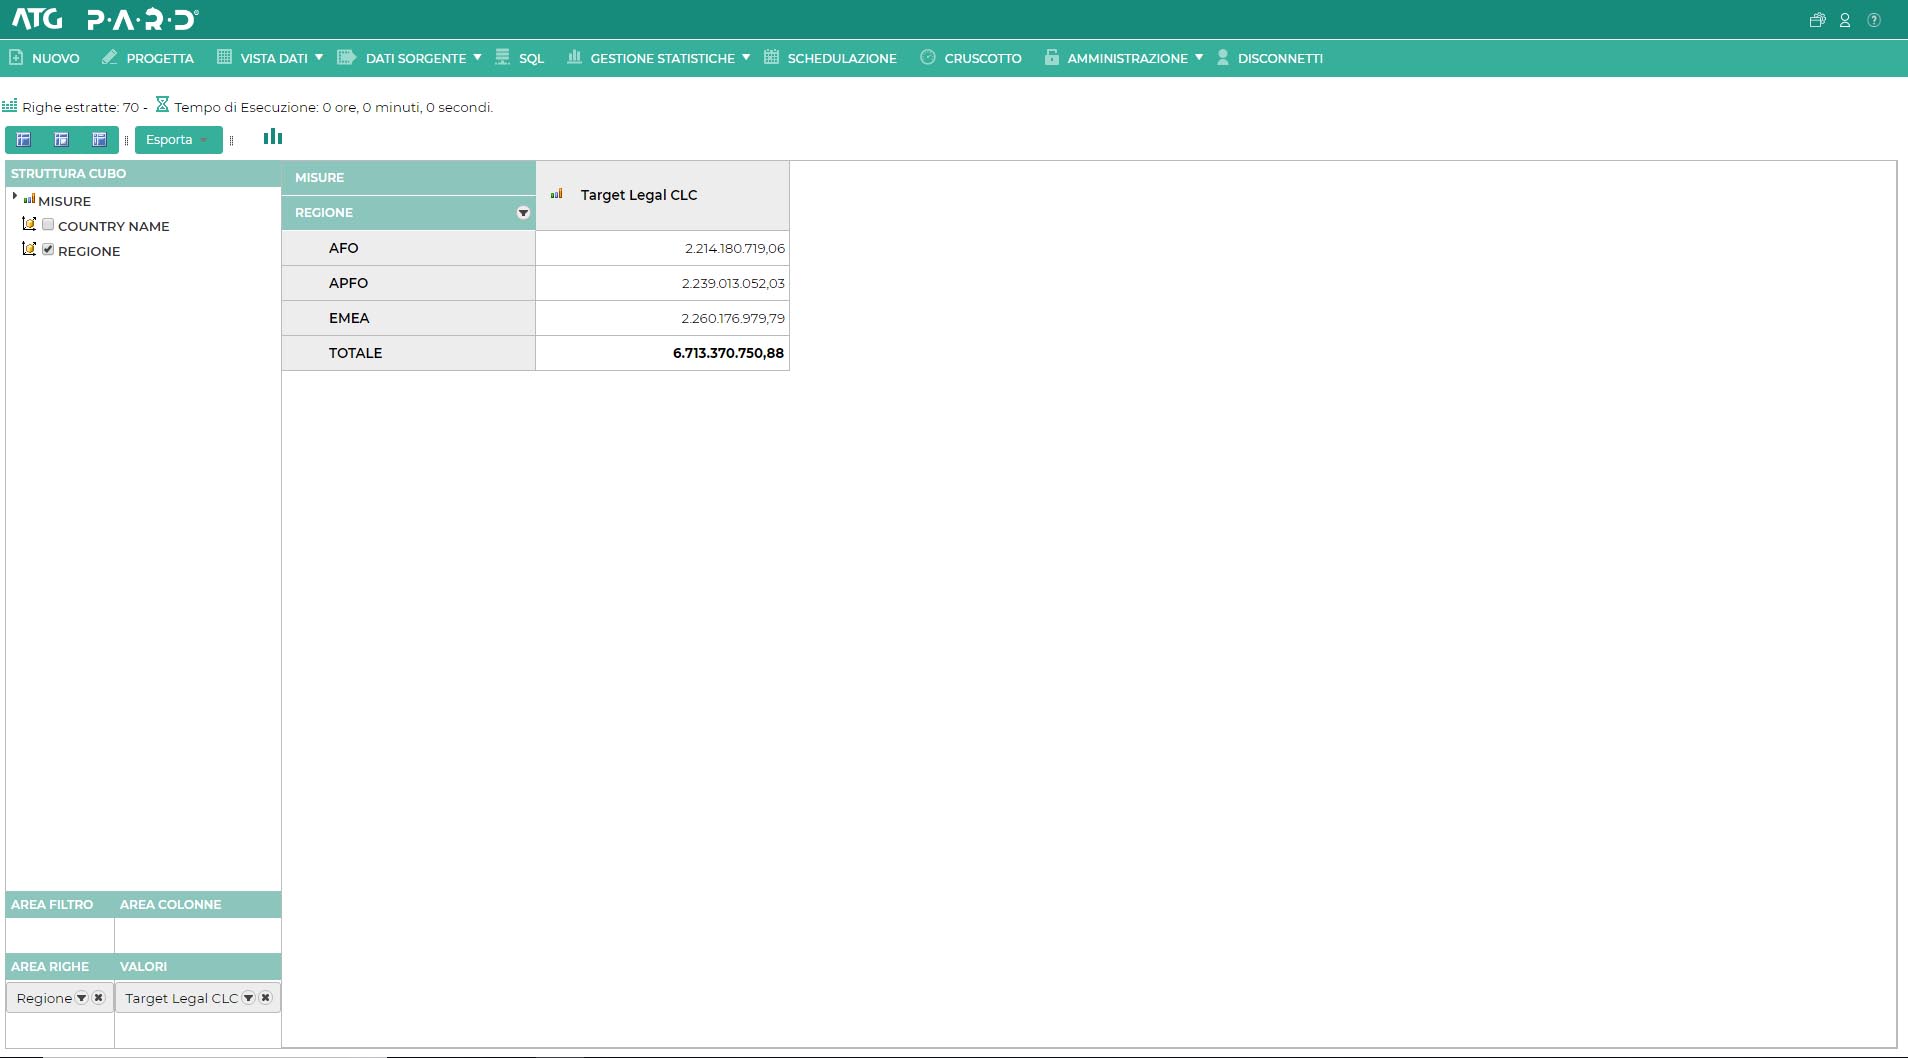
VIEW ANALYSIS DATA
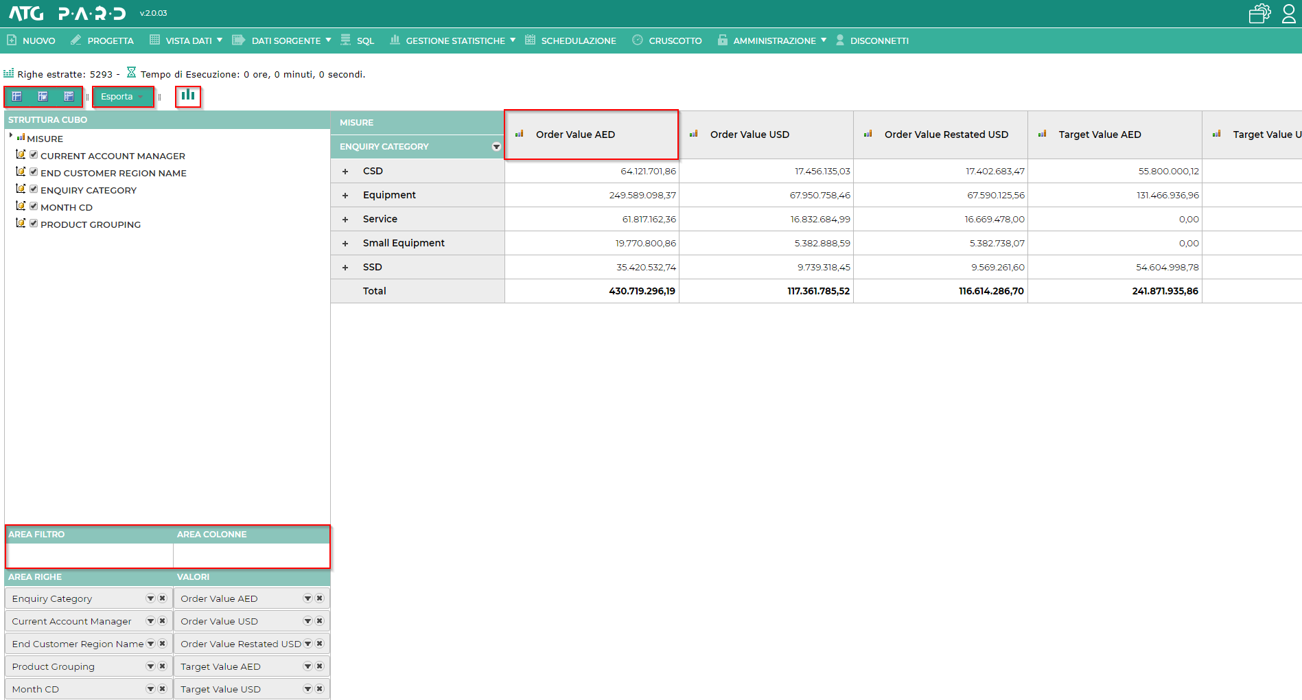
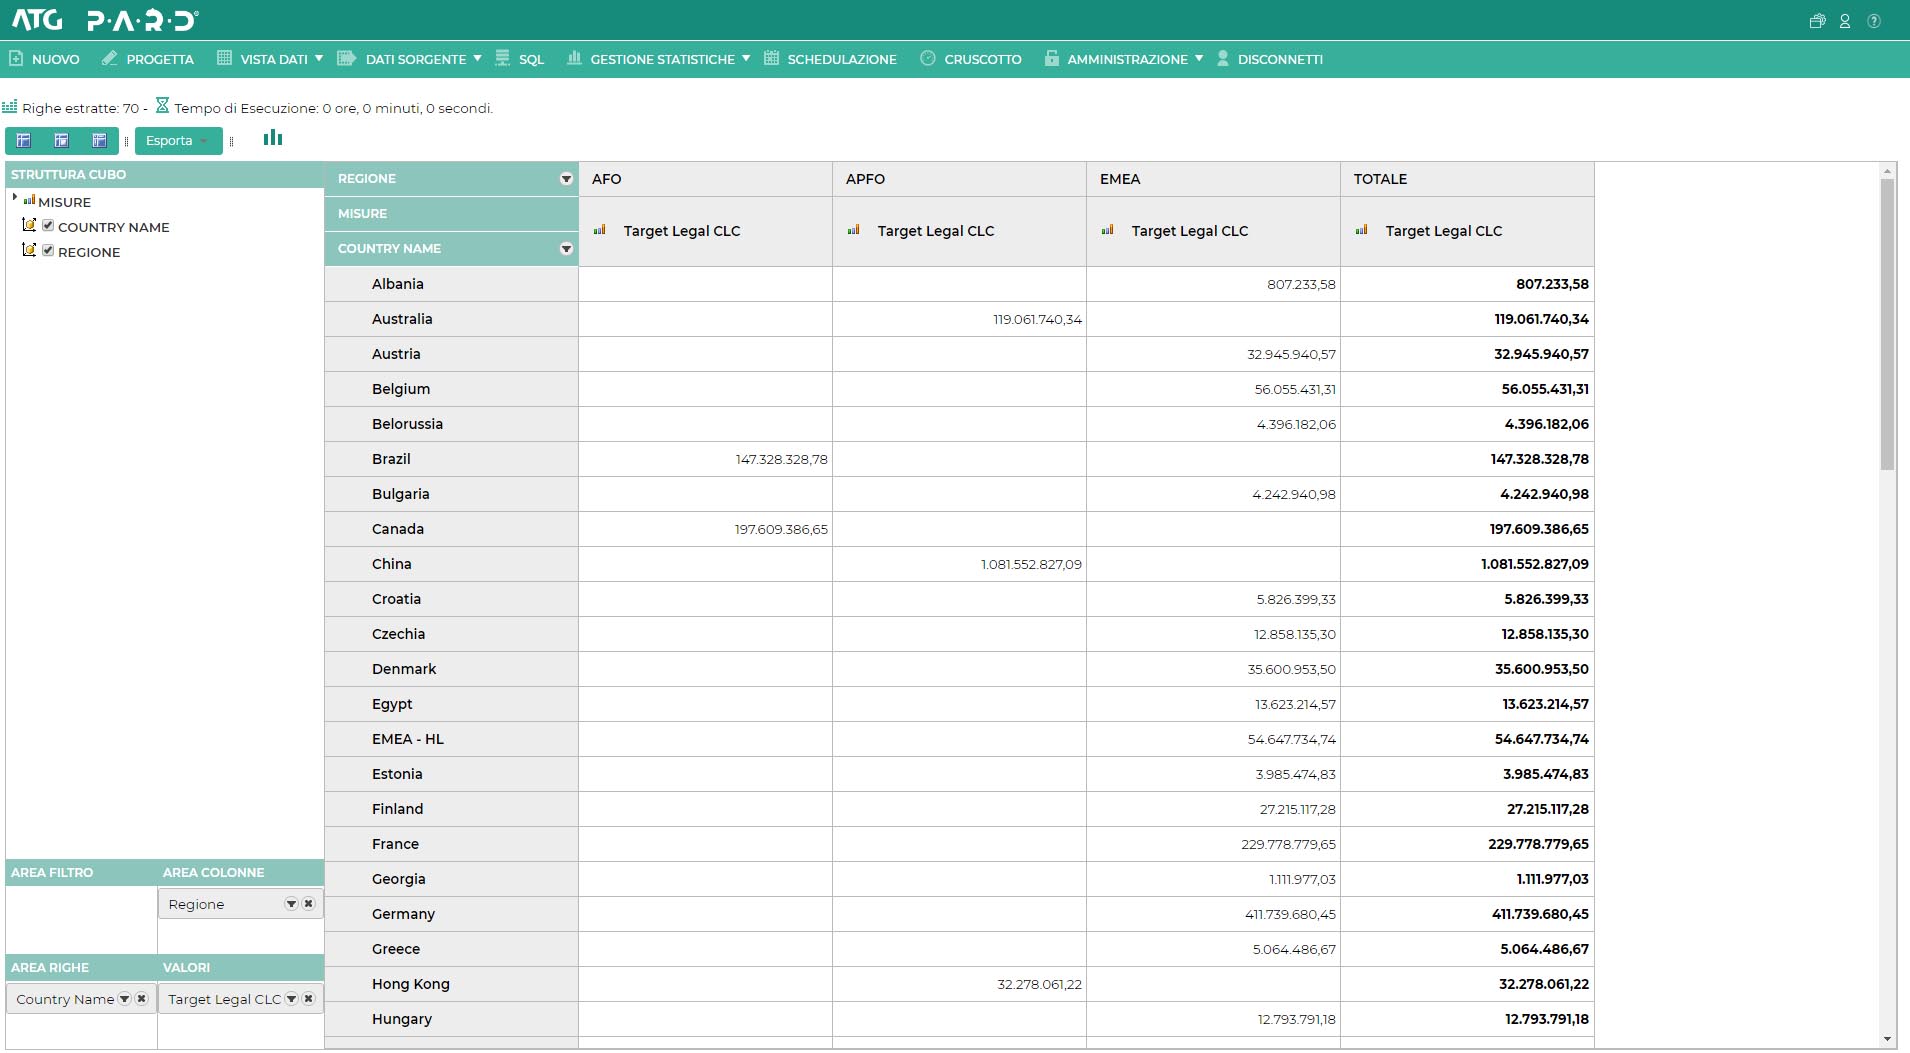
INTERACTIONS WITH PIVOT TABLE
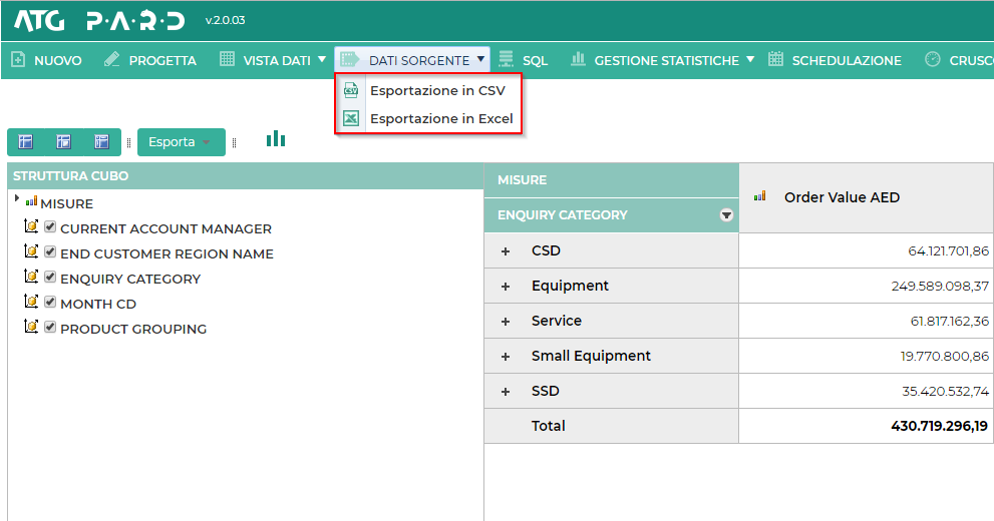
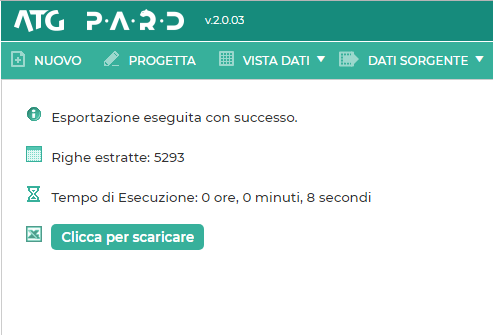
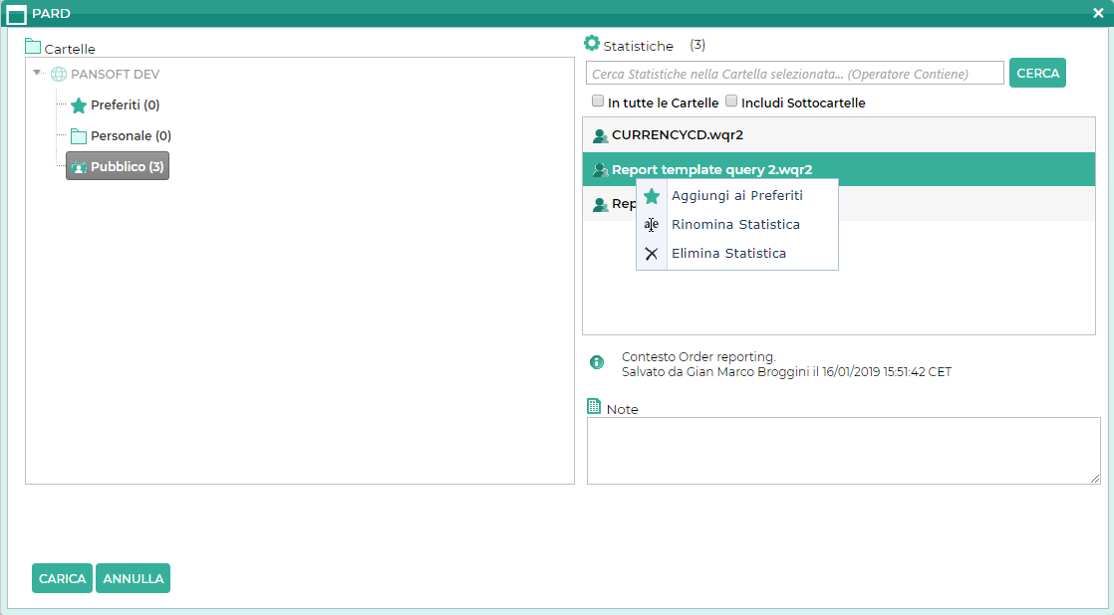
ANALYSES SAVE AND DATA EXPORT
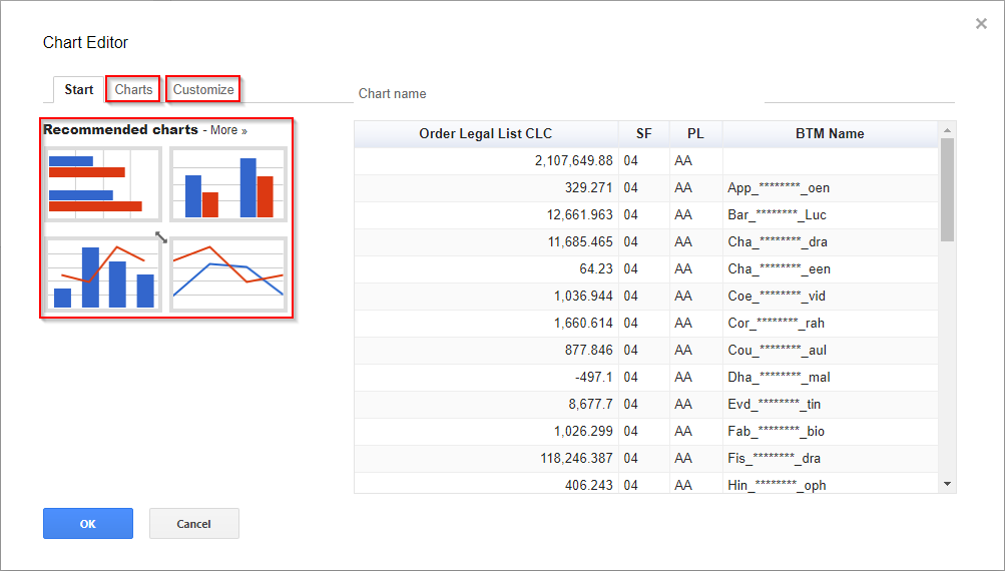
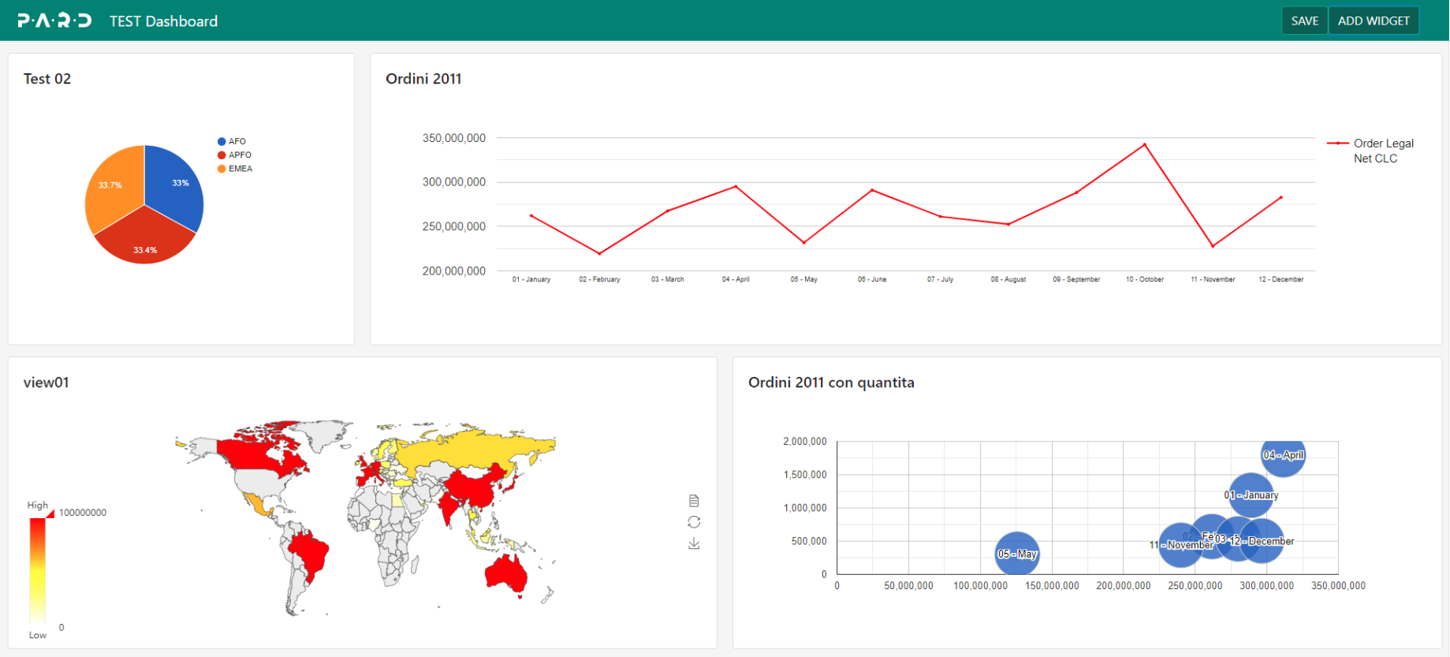
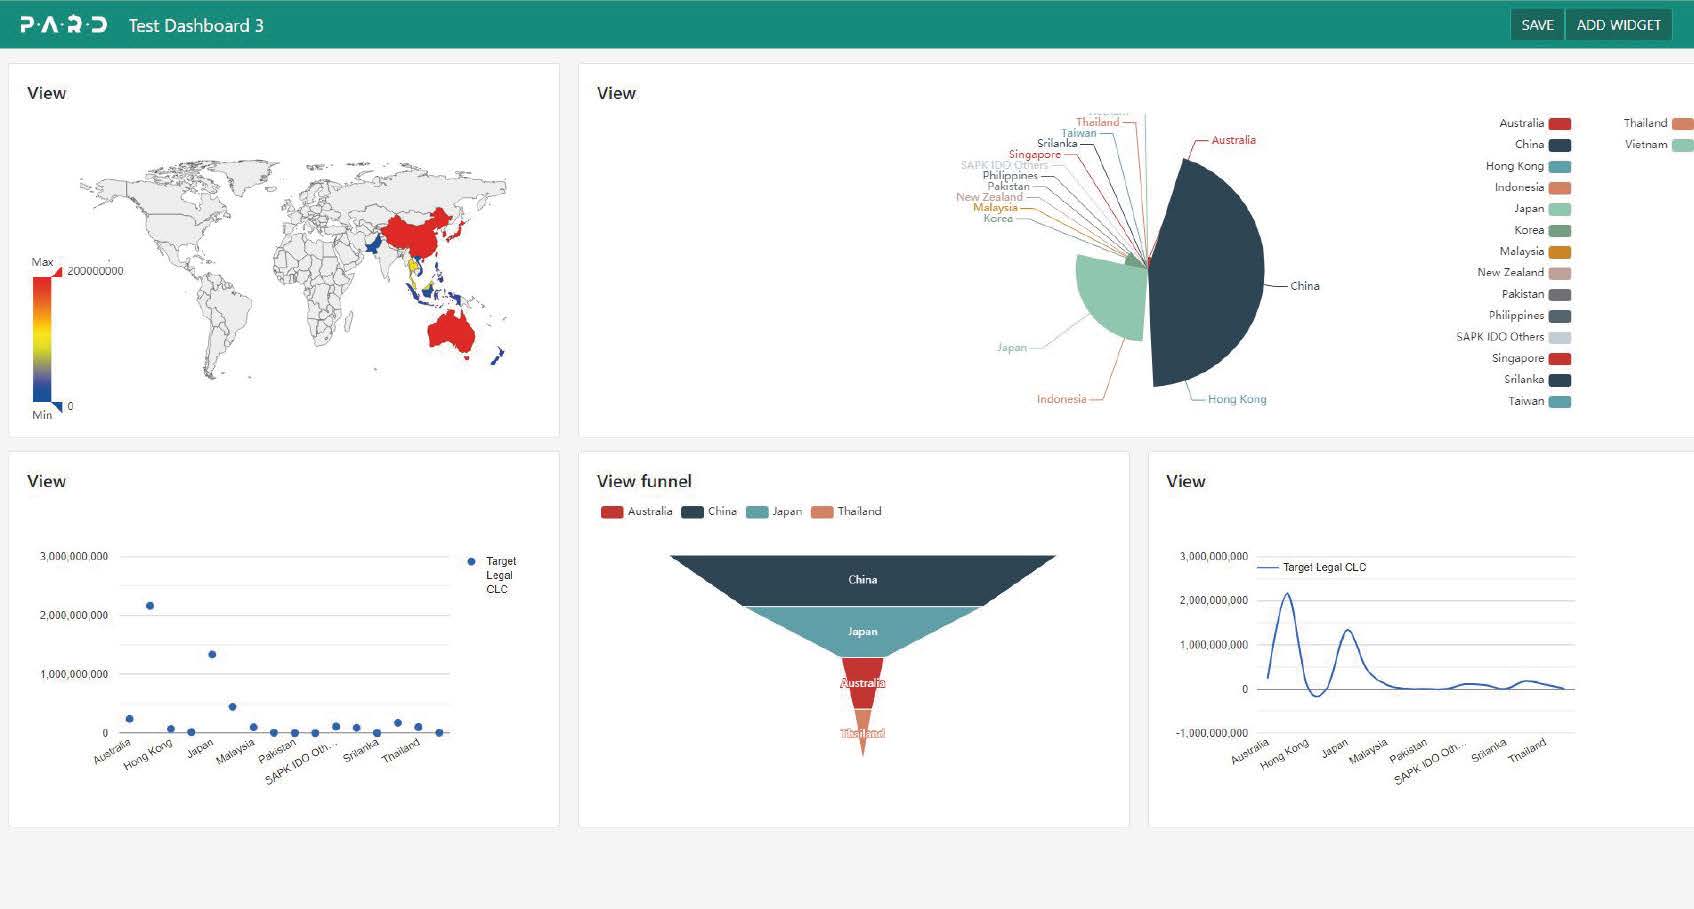
GRAPHS, BASIC AND AVANCED DASHBOARDS
In PARD® it is possible to create custom graphs and dashboard in a simple way. A basic version is already available in the software license. It is also possible to request the additional dashboard module featuring advanced features with professional graphs and geographic map.

WHEREVER
YOU ARE,
IN COMPLETE AUTONOMY.

ALREADY USING A BI SOFTWARE?
We’ve always been working on different types of software already present in the market, developed by major vendors:


